Screening Assistant 2
Plotting molecules
Last edited: 25/07/2011
By: VLG
Sourceforge: SA2 website
Help: SA2 forums
Documentation index
This page provides information on how to use the interactive plotting windows available in SA2. Currently, there is two ways of plotting molecules in 2 dimensions: using two properties, one per axis, or using Principal Component Analysis and DRCS models. In this page, we will illustrate the use of the XY interactive plot. The DRCS plotting facility is very similar to the XY plot, with additional features specific to the DRCS methodology.
Table of Contents
- Overview
- First plot
- Zooming / selection
- Coloring
- Specific tools - plot providers only, color one or several library...
Overview - top
The Interactive XY plot window (as well as the DRCS plot window) has been designed to easily represent each molecules using coordinates in a 2D space. These coordinates are actually, in the XY plot, any properties available in the database.
You can open the XY plot window through the main menu bar:
Window->MoleculeS->Plot->Interactive XY Plot
Opening the window for the first time, the molecular weight will be used as X coordinate, and the
calculated logP as Y coordiantes.
Note that if a molecule is missing any property used, it will not be represented in the graph.
First plot - top
When opening the XY plot window, no molecule will appear on the plot. To get a first
simple representation of your molecule, click on the following icon located on the vertical
toolbar on the right of the window:  . Clicking on this button,
you will simply plot all molecules using the currently selected properties (Molecular Weight and
calculated logP by default).
Note that this button is part of a set of other buttons that can be used to perform specific operations on the plotting window. These will be explained bellow.
Once done, you will be able to view your compounds in the interactive plot. Passing your mouse over one each point, you will notice that all SA2 windows showing information on single molecules (e.g. the 2D structure view, scaffold view...) will be updated. Selection and zooming will be further explained in the next section.

Let's briefly describe the basic features available on the horizontal toolbar on the top of the window.
- Zoom / Selection

 : triggers zooming / selection (see bellow)
 - Auto-axes: when plotting molecules, SA2 will automatically calculate the
X and Y bounds on the plot. When unchecked, the current axes bounds will be left unmodified
(and you will miss compounds if they fall outside these ranges).
- X / Y: click on this button to select the X and Y properties to use.
Note that when you change either of the properties, the plot will not be automatically updated, and you will have to use the replot button or one of the
additional tools available on the vertical toolbar.
- Color palette
 : allows you to color your molecules according to a property.
As when changing the property plotted in X / Y, the plot will not be automatically
updated.
- Replot
 : trigger again the last action used (the last button used on the
vertical right toolbar). You should use this button if you select another property for any
of the axis, or if you change the current coloring.
Zooming / selection - top
Once you have plotted your molecules, you have the possibility to interact with them. Let's describe how.
Single selection
As previously mentioned, when you pass your mouse over one point, the corresponding molecule will be displayed in all windows displaying information on the currently selected molecule. Note that doing so, the Selected molecules window will not be updated.
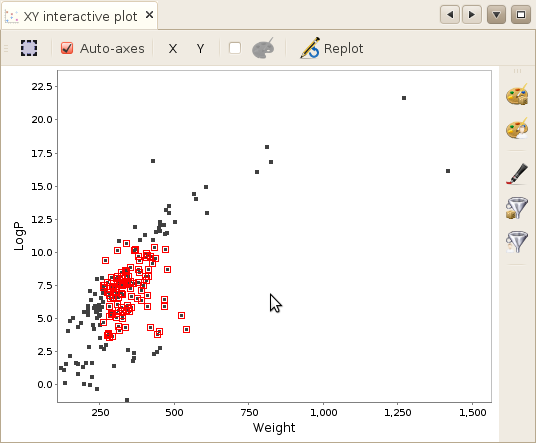
When however, you actually click on one point, the molecule will be selected both in the plot (a red halo will be drawn on the plot aroung the corresponding point) and in the Selected molecules window. Once a molecule have been selected this way, the hovering behavior will be desactivated until you deselect the molecule.
You can also press CTRL to add the clicked molecule to the current selection.
Zooming / Multiple selection
By default, the XY plot (as well as the DRCS Plot) allows you to zoom to a more specific zone of the plot by presssing your mouse button somewhere on the plot, dragging your mouse somewhere else, and releasing it. Alternatively, you can use your mouse wheel (if you have any) to perform quick automatic zooming.
The zooming behavior is triggered when the first button located on the toolbar is toggled.
By clicking it, you have the possibility to switch from the zooming behavior, to the multiple
selection behavior. When doing so, instead of zooming, all molecules located in the squared
selection will be selected.
When the multiple selection is activated, the following icon will appear:
 , while the Zooming mode will be associated with
 .
.

Coloring - top
By default, all molecules are plotted using the same color. you have the possibility
to assign a color to each molecule using one of the numeric property available in your
database. To do so, select the checkbox located next to the Color palette button,
and then click on the Color palette button  .
.

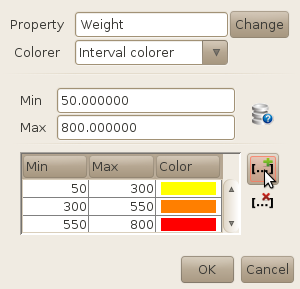
In the current version of SA2, you have the possibility to color your molecules using an
intervall colorer or a smooth colorer. The intervall colorer will basically assign a single
color to each defined interval, while the smooth colorer will apply a color gradient using
the min and max boundaries. In both cases, you have to define the bounds of the property
used to color the molecules.
Do this either yourself (if you know the property, e.g. Weight or LogP), or by clicking on the
database button  . By doing so, you will assign
the min and max values of the property as calculated on the entire database (note that the
process might be slow if you have a huge database!).
Once everything is setup, click OK to close the configuration window. Note that the plot will
not be automatically updated. You will have to press the Replot button
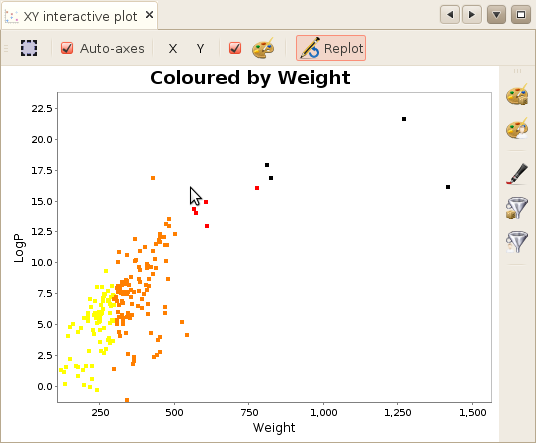
 to obtain the coloring. In the following example, we
have coloured our compounds using the molecular weight and a 3-intervall colorer.

Note: if you choose to color your molecules, and that in the same time you use a tool that also color your molecules (e.g. by library), the tool coloring will have the priority over the property coloring.
Note 2: coloring a molecule that misses the coloured property will result in a black point.
Specific tools - top
As noticed previously, a set of specific plotting tools are available through a vertical toolbar located on the right of the window. Each tool allows to you perform a specific operation, e.g. plotting only a subset of molecules, or coloring a Provider / a Library.
Here is the full list of available tools:
 Assign a color to one or several libraries. Overrides Property coloring!
 Assign a color to one or several providers. Overrides Property coloring!
 Plot all molecules with no further process. Use this tool to perform simple plot.
 Plot only a set of libraries.
 Plot only a set of providers.
Important note: the tools cannot be combined! If you use a tool that plot only
molecules that belongs providers P1 and P2, and then use a tool that color a specific library,
the result will not be "All molecules that belongs to P1 and P2, with molecules of L1 coloured
in red"! To obtain the results of this specific example, you will have to create a new
filtered library containing molecules of your selected provider, and then color it in the plot.
Note however, that you can combine any non-coloring tool with the Property coloring, e.g. you
can plot only molecules that belongs to one or several libraries while coloring the molecules
using the property of your choice.
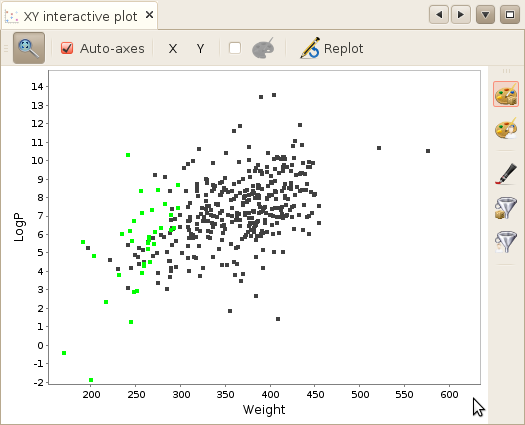
The following screenshot shows a Fragment library coloured in green (data created during the quickstart guide).
