
Screening Assistant 2 v1.0
Statistics
Last edited: 18/11/2011
By: VL
Sourceforge: SA2 website
Help: SA2 forums
Documentation index
This pages will present all statistics window available in SA2. By statistics, we mean various charting capabilities that will allow you to perform simple analysis such as viewing the repartition of your descriptors...
Table of Contents
- Histogram window - draw the distribution of your properties
- Reporting - generate various reports (scaffolds unicity between providers...)
Histogram window - top
The histogram window is a very handy way of viewing the distribution of a particular property, and to compare the distribution of this property between the database and one or several library.
Overview
As the purpose of this window is to draw the distribution of a property, you have to open both the histogram window (toolbar, or Window->Statistics->Histogram Window) and the Properties Window. Fortunately, when you will open the Histogram window, you will see that the Properties window will be opened and focussed as well, saving you an extra couple of click (time is money...). You will end-up with the following window (which will be empty in your case):

On the center of the window, you have the histogram. Here, we have plotted the distribution of the TPSA descriptor for a kinase database. Two focussed libraries are compared here, comming from two different vendors.
A last bin is showing the number of molecules that have either invalid, or missing property.
Top toolbar

- The first text show you the name of the property currently profiled.
- The opt button
 (and checkbox) allows you to define both custom boundaries for
the histogram, and the number of bins displayed. You have to select the checkbox
for the current custom options to be taken into account.
(and checkbox) allows you to define both custom boundaries for
the histogram, and the number of bins displayed. You have to select the checkbox
for the current custom options to be taken into account.
- The dropdown box allows you to select the first library to draw (red bars).
This can be the entire database, or a particular library.
- The library button
 allow to select any number of libraries to add to the histogram.
This way, you can very quickly (well... if you don't
have hundreds thousands of molecules in your database!) compare
the distribution of any descriptor between libraries.
allow to select any number of libraries to add to the histogram.
This way, you can very quickly (well... if you don't
have hundreds thousands of molecules in your database!) compare
the distribution of any descriptor between libraries.
- The Refresh button
 allows you to refresh the histogram. Use it if the Auto-update is disabled, if new
molecules have been imported since the last histogram, or if you changed the options
of the histogram.
allows you to refresh the histogram. Use it if the Auto-update is disabled, if new
molecules have been imported since the last histogram, or if you changed the options
of the histogram.
Right toolbar
- The Pie button
 allows you to switch from a histogram view, to a Pie view. This is particularily usefull
for boolean properties.
allows you to switch from a histogram view, to a Pie view. This is particularily usefull
for boolean properties.
- The Auto-update button
 allows you to switch off the automatic update of the histogram when you select
a new property. This is usefull for large databases, for which the histogram will
be slower to compute.
allows you to switch off the automatic update of the histogram when you select
a new property. This is usefull for large databases, for which the histogram will
be slower to compute.
- The Percentage button
 allows you to switch from percentages to count for the histogram. Percentages should be
used when you have libraries containing very different number of molecules.
allows you to switch from percentages to count for the histogram. Percentages should be
used when you have libraries containing very different number of molecules.
Reporting - top
Another usefull window is the Chart window, that makes it possible to generate a set of reports on the database. Let's describe it briefly.
Overview
You can open this window using the menu bar:
Window->Charts->Reporting
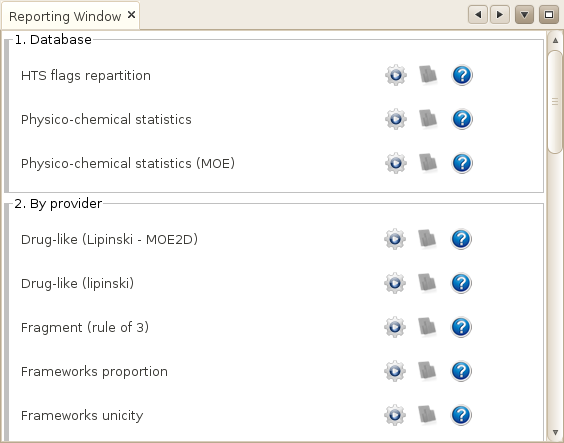
This window contains a certain number of reports that are organised in
categories. You can compute for example various reports on the entire
database, or for each provider / library.
If you click on either of the run buttons
 ,
the associated report will be generated in background. Once done, you will
be able to display it using the reporting button
,
the associated report will be generated in background. Once done, you will
be able to display it using the reporting button

Here is an example of report on physicochemical properties (MOE2D descriptors), and of framework unicity (two providers).
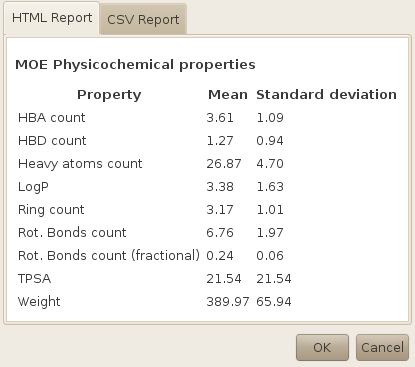
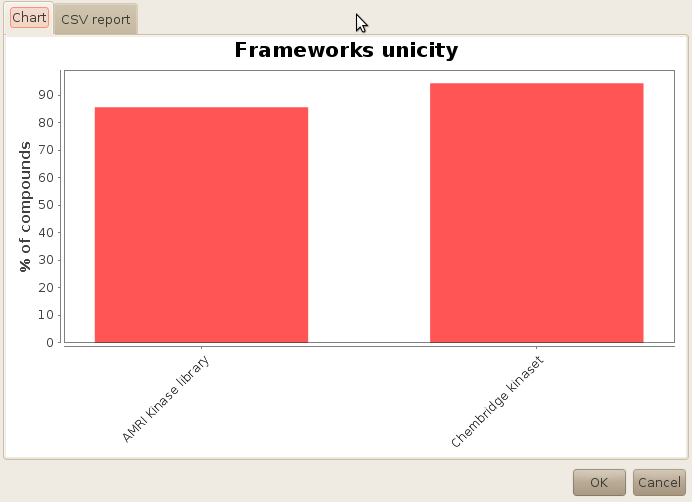
For each report, you usually have a chart or HTML intuitive view to get a rapid insight into the results, and a text-based report that you can use if you want to exploit the data elswhere (e.g. in Excel).