
Screening Assistant 2
Similarity-graph view
Last edited: 16/11/2011
By: VLG
Sourceforge: SA2 website
Help: SA2 forums
Documentation index
This page provides information on how to use the interative similarity-graph view available in SA2. This view allows you to plot molecules under the form of a network (or graph): nodes represent molecules, and edges represent the similarity between two molecules. The applicability domain of this view is SAR / SPR on small datasets. In particular, it can be used to identify so-called activity cliffs, i.e. two very similar molecules (two linked nodes) showing different activity (different color), clusters of similar molecules showing similar activity (densely connected nodes)...
Table of Contents
Overview - top
The similarity graph view is an alternative way of viewing your compounds in a 2D plot. Unlike XY or PCA plots, molecules here do not have any particular 2D coordinates based on properties. Instead, they are represented under the form of a graph. Nodes of the graph represent molecules, and edges of the graph represent the similarity between two molecules. The position of the nodes and edges are determined on the fly by so-called layout algorithms. These algorithms automatically position nodes, usually in such a way that group of connected nodes (similar molecules) are connected together.
The similarity between two compounds is computed using the tanimoto coefficient, and using one of the available fingerprint as compounds description. In the view, only edges corresponding to a similarity greater than 0.7 are represented, in order to reduce the memory needed and make the visualisation interpretable. In other words, only fairly similar molecules (nodes) will be linked by an edge. Furthermore, the number of molecules is limited to 1000, and thus, only libraries containing less than 1000 molecules can be used in this view. Two main reasons for this: some layouts are very slow for large graphs, and the time needed to compute the similarity matrix is of course dramatically increasing with the number of molecules.
Drawing graph - top
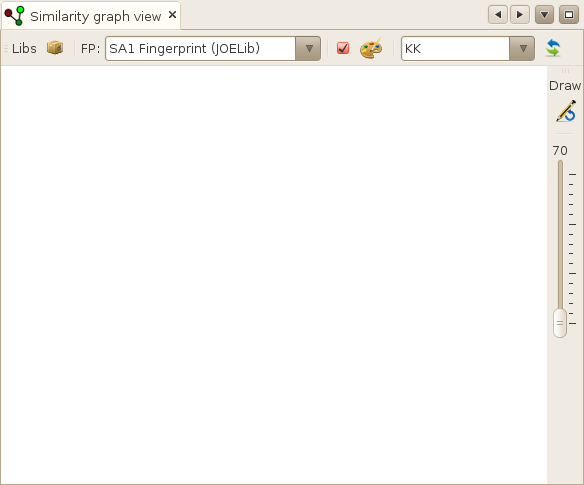
Before drawing the data, you will have to select the library to draw. To do so, click on the Lib button, located on the left of the top toolbar of the window.
You can plot only 3 libraries. They will be represented by different shapes on the graph. Note that if no library is available in the database, or if all your libraries have more than 1500 molecules, you will not be able to use this view.

Once done, just click on the Draw button located on the right toolbar. You will end up with a set of nodes, eventually connected by edges. You can subsequently update the similarity cutoff and increase it in order to restrict to highly similar molecules. If you change the fingerprint, you will have to redraw the entire thing, and so it is when coloring nodes with a property (see the following section).
Mouse interactions - top
Once you have plotted your molecules, you have the possibility to interact with them. Let's describe how.
Selecting / Centering a single molecule
Click on one of the node to display the corresponding molecule, in all windows displaying information on the currently selected molecule.
You can also hold CTRL and click a node to center it on the view.
You can also hold Shift to add a single molecule to your selection. If you don't, the previous selection will be cleared and upadted to the molecule corresponding to the clicked node (or just empty of you clicked an empty zone).
Multiple selection
You can select a set of molecules by presssing your mouse button somewhere on the view, dragging your mouse somewhere else, and releasing it.
Again, holding shift will allow you to add the selected molecules to your current selection.

Zooming and translating
Zooming is performed using the mouse wheel, while you can translate the current graph using the right button of your mouse.
Coloring - top
By default, all molecules are plotted using a drab gray color. You have
the possibility (just as in other plots) to make it much more glossy
by assigning a color to each molecule using one of the numeric property
available in your database. To do so, select the checkbox located next
to the Color palette button, and then click on the Color palette
button  .
.
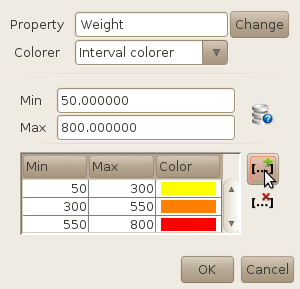
In the current version of SA2, you have the possibility to color your molecules using an
intervall colorer or a smooth colorer. The intervall colorer will basically assign a single
color to each defined interval, while the smooth colorer will apply a color gradient using
the min and max boundaries. In both cases, you have to define the bounds of the property
used to color the molecules.
Do this either yourself (if you know the property, e.g. Weight or LogP), or by clicking on the
database button  . By doing so, you will assign
the min and max values of the property as calculated on the entire database (note that the
process might be slow if you have a huge database!).
. By doing so, you will assign
the min and max values of the property as calculated on the entire database (note that the
process might be slow if you have a huge database!).
Once everything is setup, click OK to close the configuration window. Note that the plot will not be automatically updated. You will have to press the Draw button on the right toolbar to redraw the data.
Note: coloring a molecule that misses the coloured property will result in a black point.
