
Screening Assistant 2
Diversity selection
Last edited: 21/11/2011
By: VLG
Sourceforge: SA2 website
Help: SA2 forums
Documentation index
This page describes the main algorithms available in SA2 to perform diverse subset extraction.
Table of Contents
Introduction - top
Diversity is an important topic in library design. The main idea is that a general-purpose (and even sometimes target specific) screening library should contain a wide range of chemotypes in order to maximize the chance of getting hits out of a screening campaign. Using diversrity also ensure that most (ideally all) parts of the known chemical space will be represented in the library.
SA2 provides the possibility of extracting diverse subsets of molecules using a scaffold-based algorithm. The diversity selection can be performed on the whole database or on an existing library. This way, one can restrict the search to a carefully selected set of molecules.
Algorithm - top
The base algorithm has been designed to ensure the presence of one molecule per scaffold(or framework, up to you!), when possible. It starts by retrieving all scaffolds within the database (or the selected library). These scaffolds are either randomly shuffled, or ordered by decreasing number of associated molecules. The first molecule is added to the library as being the molecule that is the most similar to an average fingerprint computed on all the molecules that belong to the first selected scaffold. The similarity between two molecules is defined by any similarity coefficient (e.g. Tanimoto) available in SA2 applied to the selected fingerprint. Next, for each remaining scaffold, the molecule having the lowest similarity to the currently selected molecules is added to the library.
A maximum similarity cutoff can also be defined. For a particular scaffold, all candidate molecules that have a similarity to the already selected molecules greater than this cutoff are not accepted, thereby ensuring that similar scaffolds are not over-represented in the library. The counter part of this is a higher computational complexity if the similarity cutoff is defined too small.
Once all the scaffolds have been processed, the final number of molecules may still be lower than the desired size of the library. Two reasons can lead to this situation: (1) the number of scaffolds in the database is lower than the required number of molecules, and (2) the similarity cutoff used is too small. In both cases, the entire selection process is just repeated. In the second case, the cutoff is automatically increased for each new run. The selection process finally stops when $ N $ molecules have been selected.
Computing a diverse subset - top
Let's now illustrate the creation of a diverse subset using SA2. You need the demo database (either follow the quickstart guide, or create it directely) to run this simple example.
-
Run the wizzard using the top menu bar:
Compute->Library->Diverse->Diverse subste (Scaffold-based) -
Enter a name and a size for your diverse library.

-
Click next.

-
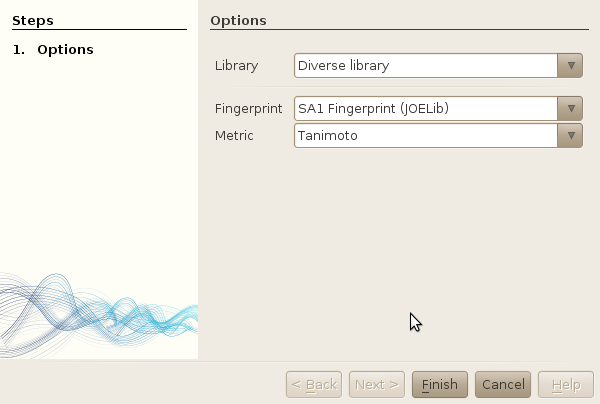
Let's detail a bit each option:
- Fingerprint: the fingerprint used to compare molecules. Only one is available here, as we have only imported the JOELib fingerprint during the quickstart guide. If you compute other fingeprints using workers, they will appear in the list as well.
- Metric: the metric used to compute the similarity between two fingerprints (two molecules). Only tanimoto is available to date.
- Core structure: whether to use the framework or the scaffold as center of each cluster in which each molecule will be picked.
- Core structure selection: order scaffolds by frequency or randomly of occurence to select the molecules. Using an ordered list is usually prefered in order biais (a little) the selection toward a representative subset.
- Use similarity cutoff: ckeck this option if you want to impose a maximum similarity cutof on the pairwise similarity in the final library. It makes it possible to avoid redundancy that could arise when two scaffolds are very similar. On the other hand, it will increase the time needed to create the library (which is not a problem for this example).
- Max. similarity: the similarity cutoff.
- Incr. similarity: if, after looping over all scaffolds, the number of molecules selected is lower than the number of molecules required, the algorithm will repeat the process, and increase the cutoff by the value of this parameter.
- Let the default options then. Click finish.
The library should now be created and visible in the "List of libraries" window.
Evaluating the diversity - top
There are many ways of evaluating the diversity of a library. As you may know, diversity is not an absolute concept, and it is advised to analyse your library using different ways. Here, we will only discribe one way of doing so, using the Similarity report.
Other ways of evaluating diversity using SA2 include: plot the library in a reduced chemical space, compare the distribution of various descriptors with the database or other libraries, compute a scaffold / framework report... Soon (hopefully), some DRCS-specific indices will be integrated to provide further ways of evaluating this diversity.
Let's generate a similarity report then:
-
Compute->Similarity->Similarity report
- Select the library you've just created. Leave all other options as is (you should not have the choice anyways if you used the DemoDB!)
- Click finish.
The report should be generated very quickly as we only have 100 molecules in our diverse library. As the report generates all pairwise similarity within the library, it might be much smaller for medium or large libraries.
The first thing you will see is the distribution of the average pairwise similarity.

It gives you a good idea on how, on average, each molecule is similar to the entire library, which is a good start: if the histogram is biaised on high values, your library is certainly not diverse (or your fingerprint not discriminative regarding the molecules in your database!), and you can drop us an email to tell us that our diversity algorithms is crappy! :)
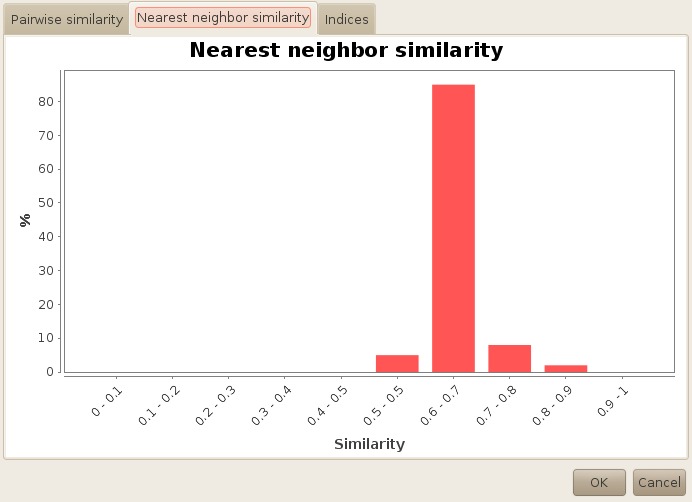
On the second tab, you will end up with similar information, but this time you will get the distribution of the nearest neighbor similarity. Here, you can see that most of our molecules have a nearest neighbor similarity around 0.7. Alone, this information has little interest, except when the histogram is completely biaised toward one or another way. Now if you compute the same report on the whole database, you will end up with the following chart:
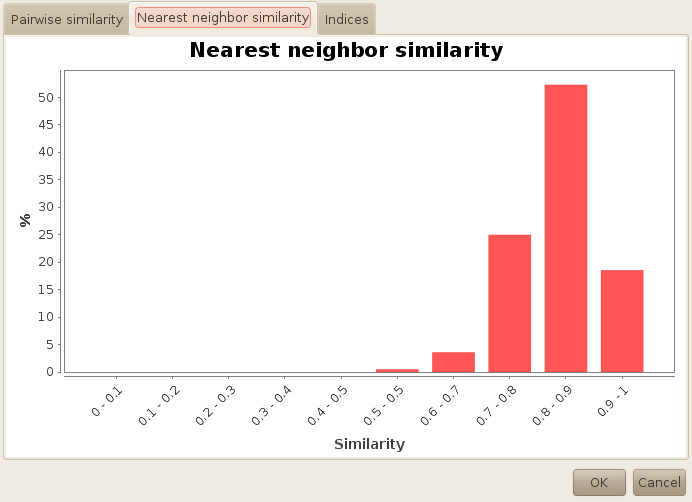
Hopefully, you can see the difference, and conclude that the diversity selection was fairly successfull...
Finally, this information can be summirised by numerical values, which you can see in the third tab.
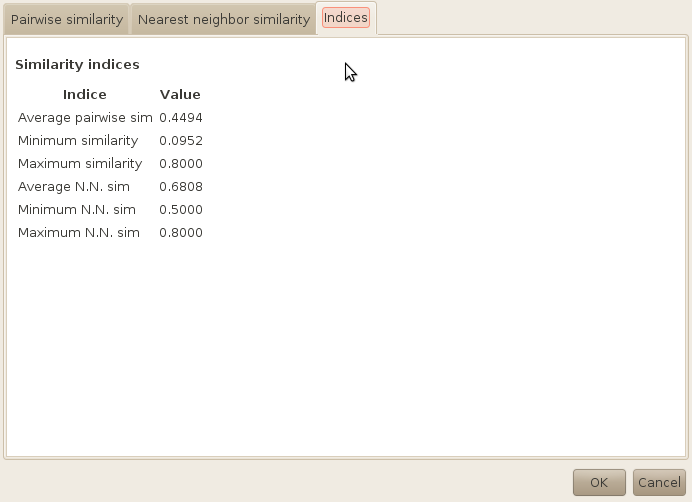
As you can see, it was possible to create a subset of 100 molecules with no pair of molecules having a tanimoto similarity up to 0.8 using the JOELib fingerprint (which is small and therefore quite generic). Remember that the cutoff was set to 0.6 at first, which means that the algorithms had to perform two iterations to obtain the diverse subset.